Downstream processing
Common problems
Downstream challenges are rarely about execution — they’re about not knowing which lever actually matters
Scientists and engineers involved in downstream processing typically face several difficulties:

Our solutions
Software license
Ypso-Ionic® was designed to speed up the development, optimization and scale-up of chromatographic processes. It combines 3 main functionalities, which can also be purchased independently:
SUPPORT PACKAGES
Our experts provide step by step guidance
from building a model with you to running simulations for you with the Essential,
Advanced and Comprehensive packages.
Collaborative partnership - Extended team
Our team of experts provides comprehensive downstream process development services. We work alongside your scientists and engineers, challenging assumptions and complementing internal initiatives. Acting as an extension of your team, we bring clarity by structuring data from diverse sources, testing scenarios with our models, and identifying the most relevant process levers.
Possible project goals include:
Our services let you benefit from the experience of our process experts and the capabilities of cutting-edge software tools built in-house. We propose three different packages:
EXPLORE, to get started with confidence: Set-up a first mechanistic model calibrated by Ypso-Facto's specialists and demonstrate its benefits on a concrete case study.
EXPAND, to widen tool capabilities: Take more physical phenomena into account, get more accurate predictions.
EXPLOIT, to support decision making: Capitalize on the obtained model to solve a real industrial challenge (e.g., reduce impurity content, improve yield, support filing, secure scale-up)
Custom software development
We have significant experience in developing scientific software tools for specific needs. These custom tools benefit from the solid foundations of our own software platform.
For instance, we offer a variety of web tools relying on the Ionic calculation engine to simulate specific processes with a user interface resembling the one of the machine, hiding all the details related to the model. Such tools are particularly useful for training purposes and assess process robustness.
Case studies
Process: strong cation exchange chromatography in “bind & elute” mode
Product: complex viral antigen (assembly of 5 proteins)
Results: The objective of this study was to compare mechanistic modeling with traditional Design of Experiments (DoE) methods in quantifying how Critical Process Parameters—specifically elution pH and salt concentration—influence Critical Quality Attributes such as purity and yield. These two approaches produced markedly different outcomes (Fig. 1). When compared to experimental data points, the mechanistic model demonstrated greater precision than the statistical model.
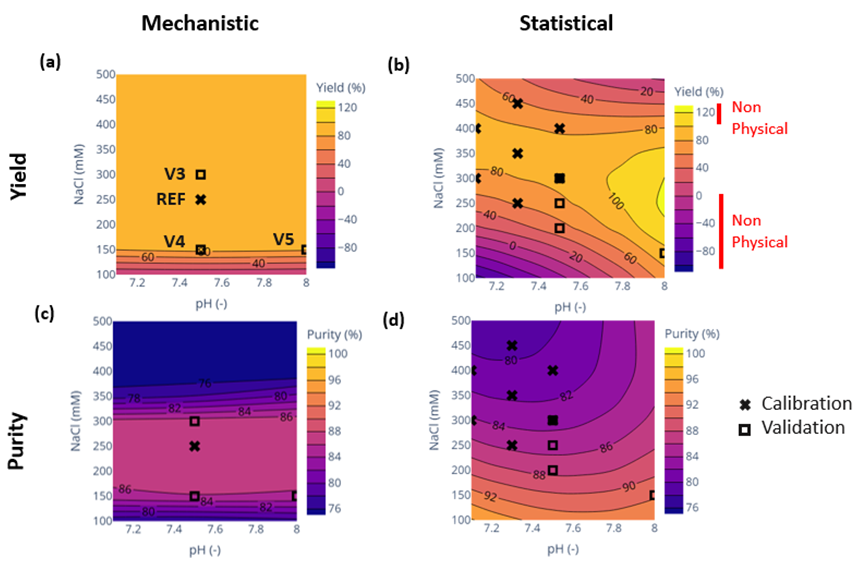
Fig. 1: Contour maps generated by mechanistic and statistical models in terms of yield and purity
The trends predicted by the mechanistic model were found to be more consistent with physical expectations than those generated by the statistical approach (Fig. 2). For example, for elution salt concentration versus yield, the mechanistic model accurately predicts that increasing salt concentration leads to higher yields up to a maximum of 100%, corresponding to complete product elution. In contrast, the statistical model predicts a bell-shaped curve where yield decreases at high salt concentrations—a result that is not physically plausible. This unrealistic trend is due to limitations in analytical precision and constraints imposed by fitting only linear or quadratic models.
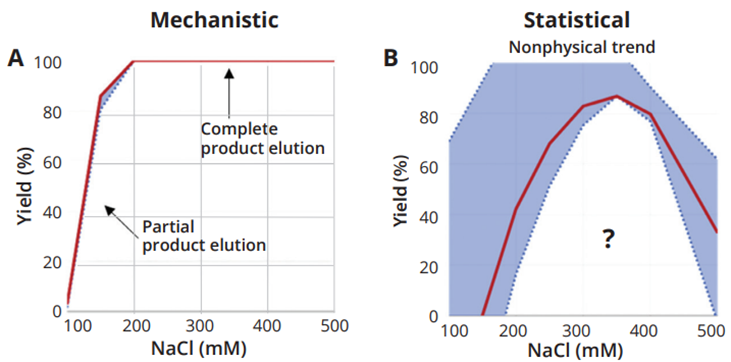
Fig. 2: Trends of the yield as a function of NaCl concentration in elution buffer generated by the mechanistic and statistical models
Furthermore, this study confirms that statistical models should not be used for extrapolation beyond experimentally studied regions. Specifically, yield values exceeding 100% and falling below 0% were predicted in pH and salt concentration ranges that were not experimentally tested. A comparison summary of the two approaches is presented in the table below.
|
|
Mechanistic |
Statistical |
|
Purification experiments to build the model |
6 |
18 |
|
Generated samples for analytical assays to build the model |
29 |
55 |
|
Reliability of trends of CQAs vs CPPs |
High |
Moderate |
|
Possible trends of CQAs vs CPPs |
Any |
Linear/quadratic |
|
Possibility to extrapolate outside the investigated space |
Yes |
No |
Key message: establishing trends of CPPs vs CQAs is more reliable and requires less experiments with mechanistic modeling than with statistical DoE approaches.
Process: weak cation exchange chromatography
Product: serum albumin (S.A.) and serum transferrin (S.T.)
Results: The aim of this case study is to demonstrate how simulation can assist in identifying better separation conditions. Two proteins, serum albumin (S.A.) and serum transferrin (S.T.), were purified on a weak cationic resin using a pH step gradient. The column was first equilibrated with an acetate/phosphate buffer in a 2:1 ratio at pH 4.8 with 40 mM Na+. Subsequently, a step gradient was applied using the same buffer at pH 7.0. A significant overlap between the two peaks is observed (Fig. 1).
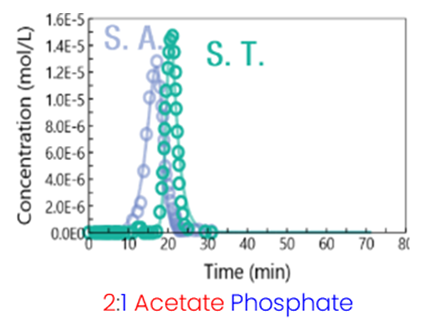
Fig. 1: Initial separation between serum albumin and serum transferrin
Investigations aiming at improving separation performances began by performing the pH step gradient with buffers alone. It was found that phosphate and acetate behave very differently (Fig. 2). The rise from pH 4.8 to pH 7.0 occurs rather steeply after around 8 bed volumes in the case of phosphate. In contrast, the pH rise is much smoother and takes much longer in the case of acetate, with the inlet pH not being reached even after 25 bed volumes. Remarkably, the simulations (lines) describe the experimental data (symbols) well.
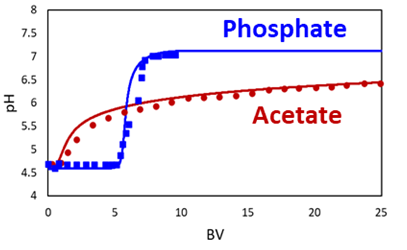
Fig. 2: Outlet pH profiles obtained with a step gradient from pH 4.8 to 7.0 with acetate and phosphate buffer solutions
Next, the study focused on the proteins alone. The theoretical curve of the charge versus pH was calculated based on the sequence of amino acids (Fig. 3). It was found that the two proteins have very similar charges, which explains the difficult separation. However, there is a sweet spot at around pH 6, where the charges of the two proteins differ. This suggests that maintaining a pH around 6 in the column is expected to better exploit the differences between the two proteins and thus improve the separation. Considering the graph above, this can be achieved by increasing the acetate/phoshphate ratio.
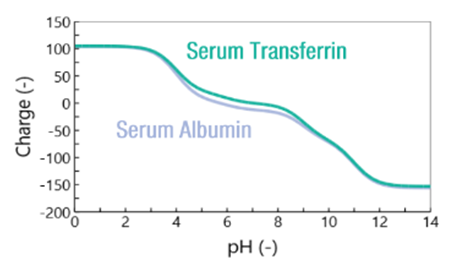
Fig. 3: Calculated protein charge as a function of pH
Experiments confirmed that separation could be enhanced by simply increasing the acetate/phosphate ratio to 20:1, without changing the resin, which is often the first approach considered for improving separation (Fig. 4, left). While increasing the acetate/phosphate ratio significantly improves yield, it negatively impacts the Process Mass Intensity (PMI) due to the longer separation time and increased buffer usage (Fig. 4, middle and left). The model was then employed to find an optimum in terms of yield and PMI by evaluating different acetate/phosphate ratios and initial pH values. It was determined that maintaining the same initial pH and increasing the acetate/phosphate ratio to 2:1 resulted in the best PMI with maximum yield.
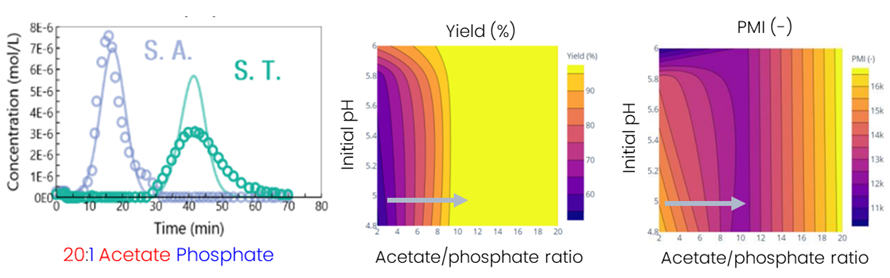
Fig. 4: Improved separation conditions
Key message: Our ion exchange model can predict the impact of a change in buffer type
Further reading: Application note: prediction of the impact of buffer type with mechanistic simulation
Process: hydrophobic interaction chromatography (HIC)
Product: several proteins
Results: The aim of this case study was to showcase the ability of a hydrophobic interaction chromatography (HIC) mechanistic model to predict the effects of pH and ionic strength on process performance. Initially, a model was developed to forecast how these two process parameters influence the retention time of two model proteins (Fig. 1). It is observed that retention first decreases (salting-in) and then increases (salting-out) with ionic strength. Additionally, retention is highest near the protein's isoelectric point (pI). The simulations (lines) align well with the experimental data (dots).
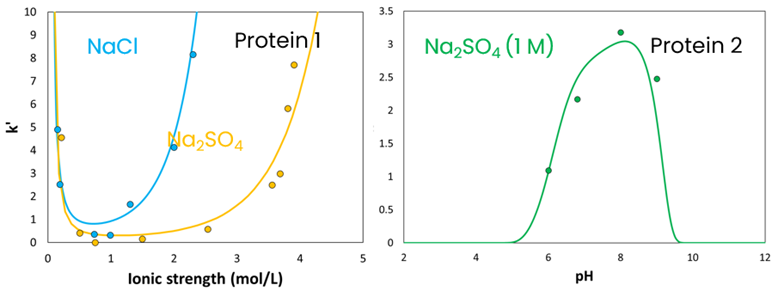
Fig. 1: Impact of ionic strength and solution pH on two the retention of two model proteins
In a second step, the model was applied to a protein produced at GSK (Fig. 2). Experiments were conducted using a One Factor At a Time approach for model calibration. Subsequently, simulations were employed to predict the impact of pH and ionic strength in a full factorial design. Two purity grades were considered: the first one with the removal of low molecular weight (LMW) species eluting before the main peak, the second one without removing the LMW species. Process conditions could be identified to improve product recovery, productivity and solvent consumption for both purity grades, as presented in the figure below.
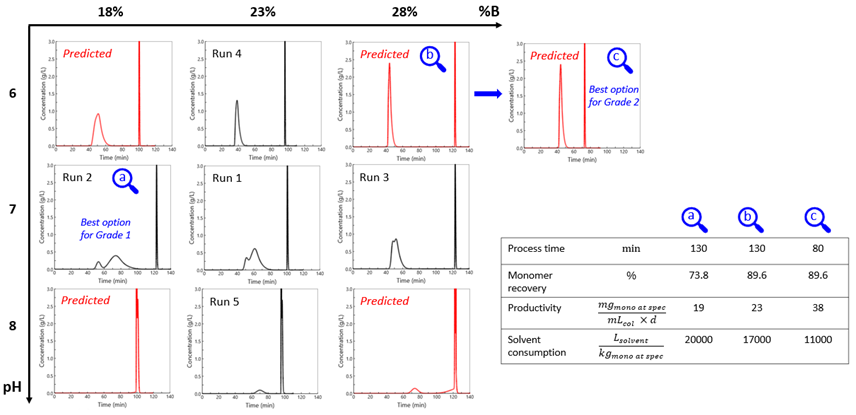
Fig. 2: Simulations performed for a protein produced at GSK
Key message: mechanistic modeling can be used to study the impact of process parameters on key performance indicators
Further reading: Purification of protein by HIC: Mechanistic modeling for improved process understanding and optimization
Process: mixed-mode chromatography (combining ion-exchange and hydrophobic interactions)
Product: antibody fragment
Results: The aim of this work was to develop a mixed mode model for protein purification. The case study deals with the removal of a low molecular weight impurity (LMW, 99 kDa) from an antibody fragment (111 kDa). The protein charge as a function of pH was calculated for both the product and LMW impurity from the theoretical amino acid sequence (Fig. 1). It is seen in the figure below that the two species have very similar charge profiles, thus making the separation difficult.
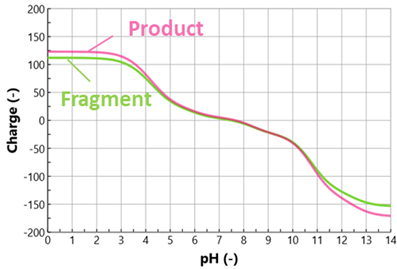
Fig. 1: Calculated protein charge as a function of pH
The mechanistic model developed in this study combines ion exchange and hydrophobic interaction models embedded in Ionic. It was calibrated using minimal experimental data, involving a series of pulse injections (e.g., very small injections) at different salt concentrations and two pH values (Fig. 2). In the case of pure ion exchange behaviour, the retention of the protein in pulse experiments is expected to vary linearly with salt concentration when plotted on a log-log scale. The figure below shows that the experimental data deviate from ion exchange behaviour (symbols), and the developed mixed-mode model accurately describes the experimental data (dashed lines). The model parameters were fine-tuned using one reference purification experiment with fraction analysis.
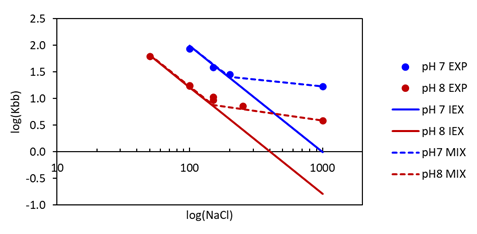
Fig. 2: Experimental and calculated retention times as a function of salt concentration
The model was used to predict the impact of two critical process parameters—loading volume and NaCl concentration in the wash—on four KPIs: purity, yield, productivity, and Process Mass Intensity (PMI), which is directly related to eluent consumption (Fig. 3). A low NaCl concentration (around 25 mM) improves purity but drastically reduces yield. While loading has little effect on purity and yield, increasing it enhances productivity and PMI due to reduced eluent consumption.
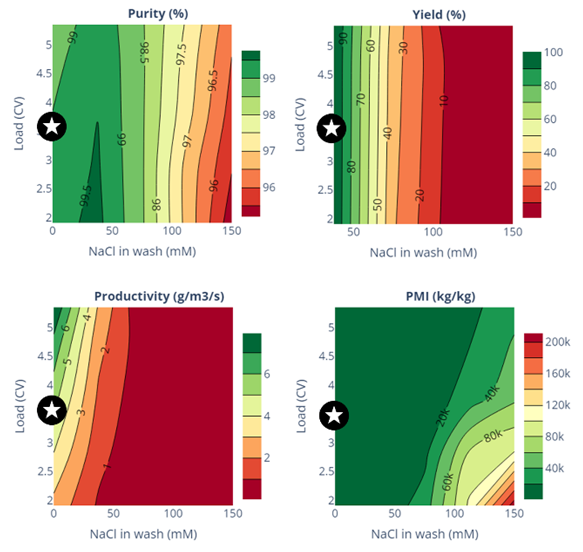
Fig. 3: Contour maps obtained with the mechanistic model
The operating conditions independently chosen by Sanofi during process development using the traditional Design of Experiments (DoE) approach are marked by stars on the contour plots. The model validates these choices, achieving sufficient purity, satisfactory yield, and acceptable productivity and PMI values. Notably, the mechanistic model's results were derived from just a series of pulse experiments (which don't require fraction analysis) and a single purification experiment (which does). In contrast, the classical DoE approach demands tens of purification experiments.
Key message: Mechanistic modeling can be used to speed up process development
Further reading: Speeding-up process development of mixed-mode chromatography with mechanistic modeling
Your questions, answered
Ionic can be used to simulate any type of chromatography commonly used for protein purification: ion-exchange, affinity, hydrophobic interaction, mixed mode, size exclusion. If your process relies on particular interaction behaviors, it is also possible to build a custom model to address your specific needs.
Yes! Ionic makes possible to simulate any multicolumn process. There is no restrictions in terms of number of columns and configurations. It is also possible to add dead volumes and collection tanks as required.
Ionic can predict the impact of numerous process parameters including (but not limited to): product concentration in the crude solution, impurity concentration in the crude solution, loading volume, flowrates, salt concentration, salt type, buffer concentration, buffer type, gradient slope.
In most simulators, the pH inside the chromatography column is simply set by the pH of the inlet solutions. However, this is an oversimplification of reality. pH can exhibit complex behaviours, such as overshoots or very slow changes before reaching the pH of the inlet buffer solutions. Ionic accurately accounts for the ionization states of buffers and proteins and rigorously describes the ion exchange mechanism. Essentially, when a molecule interacts with the chromatographic medium, it displaces ions, which can then affect the solution pH. This, in turn, impacts the ionization state and ultimately alters the retention behaviour. These intricate phenomena make the equations to be solved quite complex, but they are crucial for ensuring accurate predictive capabilities.
The number of experiments to be performed depends on the objectives of the model. The higher the expected precision, the more experiments are needed. To give a rough idea, approximately 10 purification experiments are usually sufficient to develop a first mechanistic model. The model can then be refined progressively if and when needed.
Absolutely! Unlike statistical models which are based on correlations and are only valid for their calibration data set, mechanistic model parameters have an actual physical meaning and can be applied to different process setups and process scales. This gives you confidence in scaling up your chromatography processes by changing column dimensions and even enables you to adapt the operating sequence if needed. Mechanistic modeling can also help with troubleshooting. If the scaled-up process isn’t performing as expected, you can test potential reasons via simulation and take appropriate action based on the results.
Want to know more?
Don't hesitate to contact us!