Challenge
The challenge was inspired by the experimental data reported in Pabst et al. J. Chrom. A (2008) 1181, 83-94.
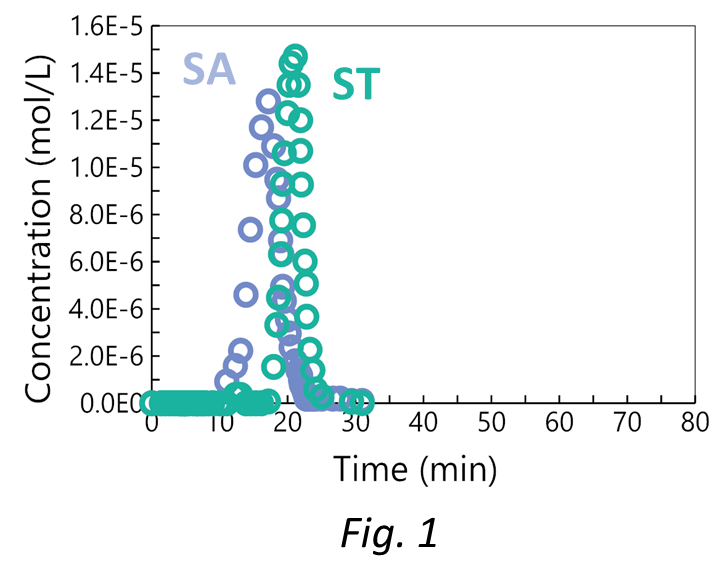
A poor separation between two proteins, Serum Albumin (SA) and Serum Transferrin (ST), was observed (Fig. 1). The separation was performed on a weak cation exchange resin with a step gradient from pH 4.8 to 7.0 with a buffer acetate/phosphate in the ratio 2/1.
This study demonstrates how mechanistic simulation can improve the separation between the two proteins, with a particular focus on the impact of the buffer type and pH.
Methodology and Result
We capitalize on the Guess ability (knowledge) of your/our experts, Predictive simulation and the physically meaningful processing of eXperimental data.
Step 1 : Establish analytical methods
The following analytical methods were used:
- Online pH
- Online conductivity to access the sodium concentration
- Online UV to access the protein concentration via peak deconvolution
Step 2: Define the list of species of interest
The following species were considered:
- Proteins: SA, ST.
- Acetate/phosphate Buffers: CH3COOH, CH3COO-, H3PO4, H2PO4-, HPO42-, PO43-, Na+, H+, OH-, H2O
Step 3: Characterize the solutions
 4 acid-base equilibria were considered, 1 for acetate (pKa=4.74) and 3 for phosphate (pKa=2.61, 6.82, 12.38).
The crude mixtures contained 3.3 g/L of SA and 3.3 g/L of ST in various buffers.
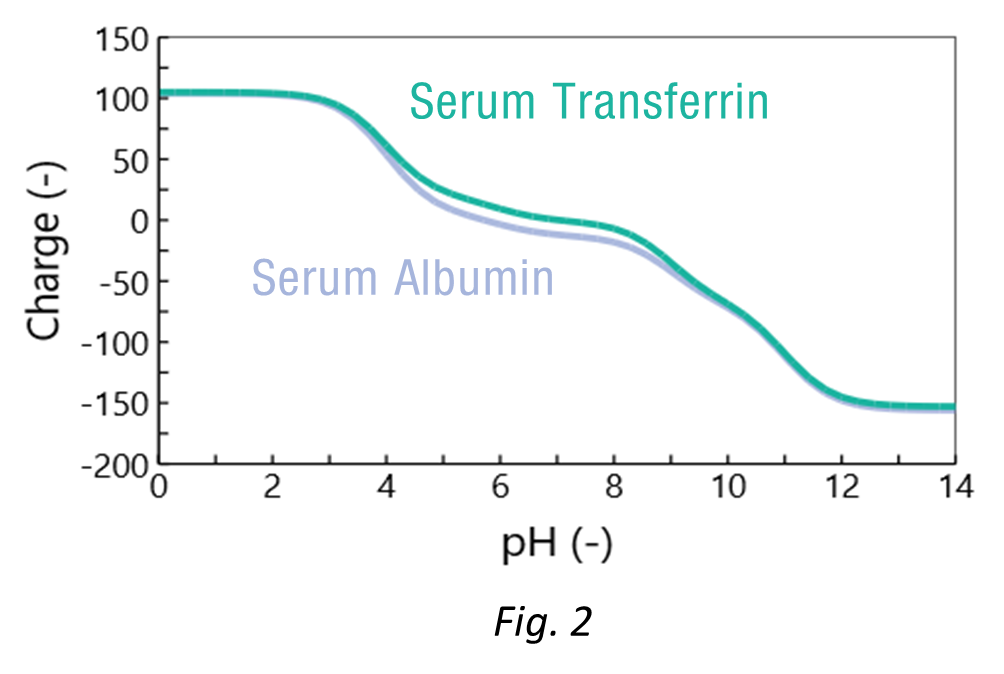
The charge vs pH curves were calculated based on the amino acid sequences (Fig. 2). Both proteins have very similar charges which explains the difficulty of the separation. At around pH 6, the difference in charges provides an opportunity for separation.
Step 4 : Characterize the chromatographic system
An 8.5 mL column (1 x 10.82 cm) packed with a weak cationic resin (UnoSphereS) was used.
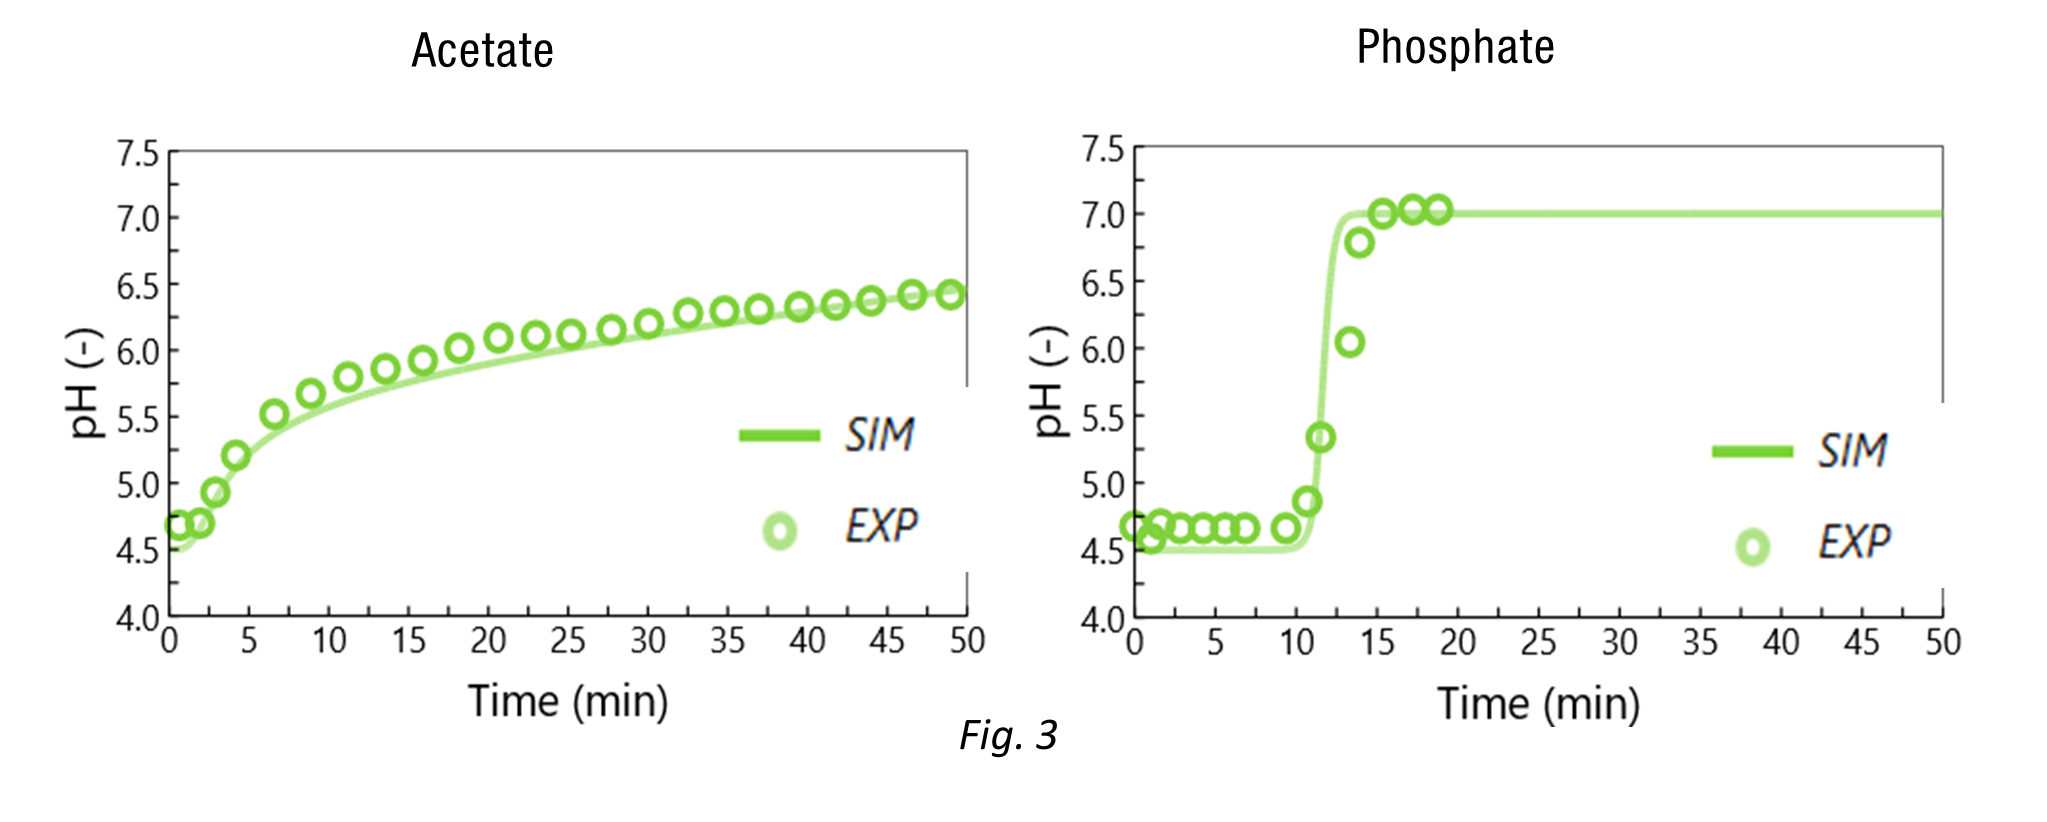
The resin capacity (NIEX=0.12 eq/Lbed) and resin dissociation constant (pK=6) were fitted based on experiments performed with buffers only (Fig. 3) at 4 mL/min. To do so, step gradients were performed: (1) the column was equilibrated with a given buffer (acetate or phosphate) at pH 4.5 with 0.04 mol/L Na+, (2) then the column was flushed with the same buffer (acetate or phosphate) at pH 7.0 with 0.04 mol/L Na+.
Remarkably, the model accurately describes well the very different pH waves obtained at the column outlet (Fig 3.):
- With acetate, a very slow continuous increase of pH was observed (the inlet pH was not reached after more than 25 BV).
- With phosphate, a sharp increase in pH was observed at around 8 BV.
Step 5 : Characterize the interactions between the solution and the resin
The model embedded in Ypso-Ionic accounts properly for the ion exchange mechanism. In other words, for each charge fixed on the resin, another charge must be released from the resin.
This means that proteins and other species in solution (like buffer species or mineral ions) compete at the surface of the resin.
In contrast to other commonly used ion exchange models, the outlet pH is predicted (and not imposed) at any time and any position inside the column.
.png)
The interactions of simple ions with the resin are described with 1 model parameter while the interactions of more complex molecules like proteins are described with 3 model parameters (Tab. 1).
In this case, modifying the acetate/phosphate ratio alters the outlet pH profile, which in turn improves protein separation (Fig. 4).
Indeed, when the acetate ratio is increased, the proteins stay longer around pH 6, thus better exploiting their charge differences (Fig. 2). The simulations (lines) are in very good agreement with the experiments of the original study (symbols). The peak broadness of ST in the model could be improved with dedicated experiments.
.png)
Step 6 : Vary key operating parameters to assess model accuracy
An experiment with the ratio acetate/phosphate 10/1 was used to confirm model accuracy. The peak position of SA and ST was found to be 17 min and 35 min, respectively, both experimentally and by simulation, thus validating the model developed.
Step 7 : Enjoy the power of simulation
The mechanistic model can be exploited to speed up process design by testing many different conditions virtually (Fig. 5). The focus here is on the impact of the acetate/phosphate ratio and of the initial pH in the column. Note that the latter has NOT been modified experimentally and the model is thus used to predict behaviors in non-explored regions.
Two performance indicators are considered to draw contour plots: the yield in ST to reach 99 %wt purity, and the Process Mass Intensity (PMI, i.e., the kg of solvent used per kg of purified product).
Increasing the acetate/phosphate ratio greatly improves the separation and thus the yield but at the expense of a higher PMI due to a longer process. Increasing the inlet pH from 4.8 to 6 at low acetate/phosphate ratios improves the separation to some extent without increasing the PMI.
.png)
Take home messages
- A pH gradient may be observed at the column outlet even if the pH is kept constant at the inlet!
- Two buffers of the same pH and ionic strength may behave very differently – the buffer type plays a key role.
- The proper selection of buffers is essential in process design to ensure protein separation.
- Predictive simulation can be used as a tool for buffer selection, reducing the experimental burden.
Explore our additional case studies
- Prediction of the impact of buffer type: Application to protein purification by IEX chromatography
- Comparison of single column and MCSGP processes: Application to oligonucleotides purification by ion exchange chromatography
- Design of a multicolumn process for mAb capture: Impact of the number of columns on key performance indicators
- Prediction of an oligonucleotide purification by IEX: Impact of key operating parameters in a complex process